
In January 2017, Statistics Canada released a new economic indicator for Canadian cities – Gross Domestic Product (GDP) for 33 Census Metropolitan Areas (CMAs) and 9 non-CMA regions. While GDP data have long been published at the national and provincial levels, the calculation of metropolitan level figures is much more difficult and time consuming according to the federal agency, requiring the synthesis of a wide range of data sources.
GDP is most widely accepted statistic used by economists to measure economic progress and economic output. GDP is a monetary measure of the market value of all final goods and services produced within a given period of time, typically quarterly and annually. It is typically measured and the national and provincial levels by adding together personal consumption expenditures, government expenditures, net exports and net capital formation. In short, local GDP measures the overall wealth created by people and businesses within a given region or metropolitan area.
CMA GDP is estimated from five income components across 20 goods- and service-producing sectors: wages and salaries; supplementary labour income (e.g. pension plan contributions by employers); mixed income (generated by unincorporated businesses including self-employed people); operating surplus (gross profits of corporations and government business enterprises), and; indirect taxes less subsidies (taxes that governments collect from and the subsidies governments give to businesses). These income components by industry are then benchmarked to provincial-level GDP totals from the input-output accounts. The GDP annual estimates are also in nominal terms or current dollars – that is, year-to-year changes in GDP reflect changes in the volume and prices of goods and services produced, not changes in the dollar value (inflation).

The metropolitan GDP estimates were originally released in 2014 for the period between 2001 and 2009 but only on an experimental basis. The 2017 release covers the period from 2009 to 2013. Statistics Canada hopes to reduce the time lags in publishing future data.
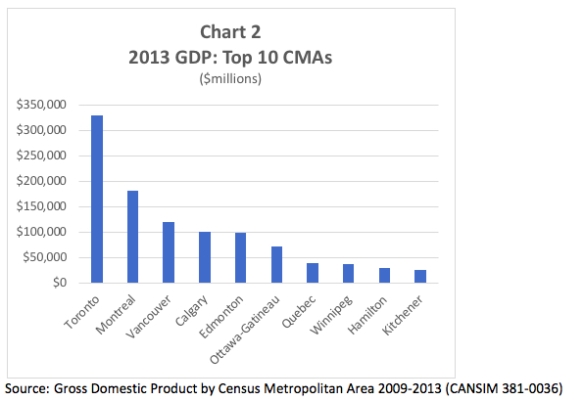
With a 2013 GDP value of $330 billion, the Toronto CMA dominates the Canadian economy accounting for 18.6% of Canada’s total economic output. When compared to US metropolitan areas in 2013, Toronto’s GDP would rank 10th (in US dollars) behind Boston and ahead of Atlanta. Adding all the metropolitan areas comprising the Greater Toronto – Greater Golden Horseshoe region (including Oshawa, Barrie, Hamilton, Niagara, Kitchener-Waterloo and Guelph) equals a total GDP of $425 billion representing 23.9%, or almost ¼ of Canada’s total GDP. The $425 billion would move the metropolitan complex to 7th place in the US metropolitan rankings behind Houston and ahead of San Francisco-Oakland.
The key drivers of Canada’s economy are also the country’s largest metropolitan areas. Just over 50% of the nation’s economic output is concentrated in the 6 largest metropolitan centres ending with Ottawa-Gatineau. The rankings of the top 10 largest urban economies also parallel their rankings in terms of population size which is expected. The one exception is Quebec which has a slightly lower population than Winnipeg (812,000 compared to 825,000 in 2017).
Chart 3 compares the economic performance of metropolitan centres and nonmetropolitan areas before and post the 2008/09 “Great Recession”. Canada’s GDP declined 2.4% in 2009 compared to 2008. According to the chart, the growth in GDP for 8 of the 10 largest CMAs was below the overall average for Canada in both time periods. Only Calgary’s and Edmonton’s economy expanded at a greater rate before and after the Great Recession which can be attributed to the booming energy and other resource-based sectors which also impacted both metropolitan centres and non-metropolitan areas in Alberta, Saskatchewan and Newfoundland/Labrador. The other 5 smaller CMAs found in the upper right quadrant include Saskatoon and Regina, St. John’s (which benefited from offshore oil exploration and development), Greater Sudbury and Barrie. Guelph also experience strong economic growth after 2009 as did, interestingly, Kingston. Sudbury’s economic growth between 2001 and 2008 reflects rising nickel prices during this period. However, the city’s GDP declined by 14% in one year during 2009 as nickel prices dropped combined with a long strike at Vale mines. Still, Sudbury’s economy rebounded strongly after the recession.
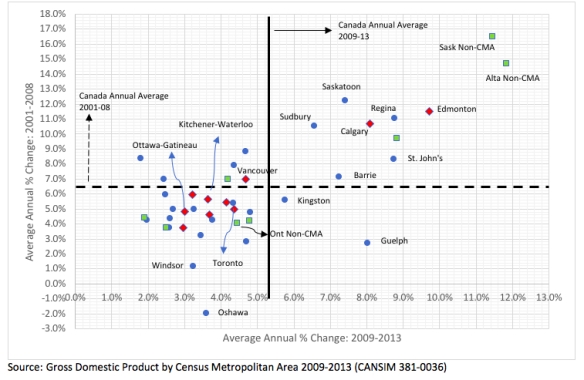
The weaker economic performance of CMAs in Eastern Canada and particularly in Ontario can be attributed to the long-term decline in the goods-producing sectors where manufacturing has historically represented a significant part of the local economic base. Oshawa for example, experienced a net decline in its GDP over the 2001-2008 period. Windsor and Niagara also performed below average. Guelph’s and Barrie’s proximity to the Greater Toronto Region provided a geographic advantage for their strong economic post-recession growth. On the other hand, Ottawa-Gatineau’s economic growth lagged behind other larger CMAs in both time periods. Only Hamilton, another manufacturing centre, performed at lower growth rates. Kitchener-Waterloo’s GDP growth rates were below the Canadian average for both time periods, although the city has been considered by many to be a booming technology centre. Still, it’s growth rates were slightly higher than Ottawa’s.
The above trends clearly show the impact that the resource- and energy-based sectors have had in the distribution of economic growth between 2001 and 2013 within Canada especially in the Western Provinces. This is reflected not only in the rapid growth of Calgary and Edmonton as major metropolitan cities (in 2001, Ottawa-Gatineau was the fourth largest CMA in terms of population but by 2017, the city has been passed by Calgary and Edmonton in size) but also in non-metropolitan areas. St. John’s and Newfoundland in general has also experienced strong economic expansion due to offshore oil exploration and development.
While the geographic GDP trends clearly reflect the shift in economic strength from the industrial heartland in Central Canada to the energy rich regions of Western Canada, the interpretation of such trends still need to be curbed somewhat from a strategic policy perspective. For example, one would be hard pressed to categorize metropolitan areas like Toronto, Kitchener-Waterloo, Ottawa or, to a lesser extent, Vancouver as being “economically depressed cities” even though their growth in GDP were below or near the national average over both the 2001-2008 and 2009-2013 time periods. This is not to say that there are other metropolitan regions such as Windsor, Oshawa and Hamilton that are being negatively impacted by their strong historical dependency on manufacturing.
Toronto still dominates the Canadian economy even though its share to total GDP has slipped since 2001. Toronto’s GDP in 2013 equalled the total for the Province of Alberta (including Calgary and Edmonton) and was still larger than Montreal and Vancouver combined.

GDP growth in metropolitan centres like Regina and in non-metropolitan areas can also be exaggerated by their smaller economic benchmark or starting point. Also, the energy sector is very capital intensive. As a result, smaller cities and non-metropolitan areas where investment in new capital is made, may experience strong GDP growth while larger metropolitan centres like Calgary and Edmonton are where head office jobs of oil companies are found.
One significant limitation of Statistics Canada’s published metropolitan GDP statistics is the time lag in the data availability where global and national economic trends can change shift very quickly. This is particularly relevant in the case of the commodity sectors such as oil and gas where the price of oil has dropped significantly during 2014 and 2015 resulting in an economic slump in Alberta – see Table 1.

The following table compares growth performances of CMAs based on population and employment trends between 2013 and 2017 relative to the 2009-2013 period corresponding to the post 2009 years of published GDP data. At least during the 2009-2013 period, population growth roughly followed growth in GDP for larger metropolitan areas, as expected, although this relationship was less consistent with smaller cities (e.g. compare Kingston with Regina). While Alberta’s economy went into a slump during 2015 and 2016, Calgary and Edmonton continued to experience strong population growth between 2013 and 2017 but the metropolitan areas’ employment growth rates did slow down but still above the Canadian average.
Hamilton experienced exceptional employment growth after 2013 as did Vancouver. Hamilton’s strong employment gains may be a reflection of the city’s proximity to Toronto and the resultant strengthening spatial and economic integration with the GTA. On the other hand, Kitchener-Waterloo had strong job growth over the 2009-2013 period which slowed considerably over the next 4 years. The non-metropolitan areas in Ontario continued to lag behind the rest of the Province and Canada.

